Introduction
This is my note summary of labs activities that includes Web, Network and Forensic investigations.
Table of Contents
- Deploying the Local Lab with VirtualBox
- Web Investigation
- Network Investigation
- Forensics Investigation
Deploying VirtualBox
CWL offers hands-on, locally deployable cybersecurity operations through realistic lab environments.
They’re usually deployable with VMware. Since I don’t have installed VMware due to difficult installation process, I used VirtualBox instead.
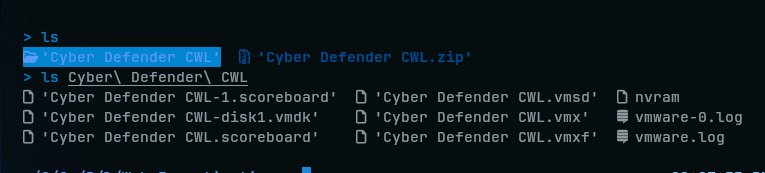
Lab files came in ZIP file, which I extracted it looks like:
Step 1 - Creating a VM
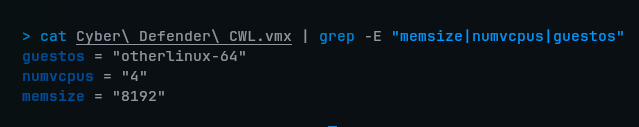
To setup these lab files originally created by VMware on VirtualBox, we must create a same VM with same settings. So, look at .vmx file to see its basic settings:
I created one VM:BTF_CWL_Lab with that same settings:
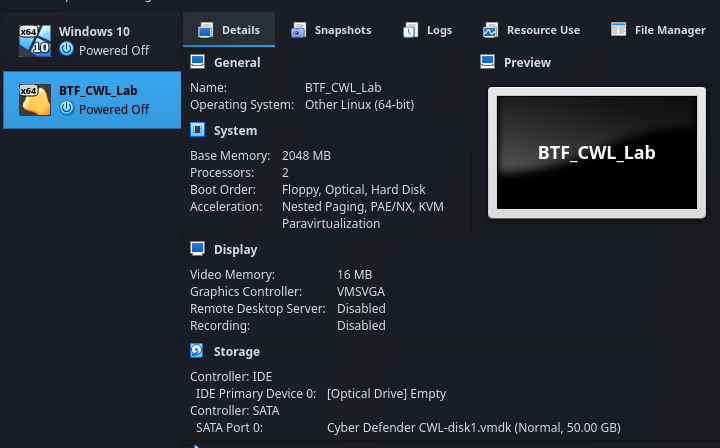
Since I don’t have high-end laptop, I lowered the Base Memory to 2GBs and set only 2 Processors (But it should work Ahaha).
One more important thing is to:
- Disable EFI option.
- Change Network settings to Bridged Adapter (otherwise, Ping might fail)
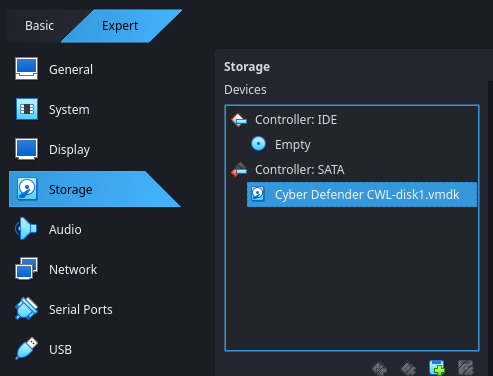
After these, I imported .vmdk file to the VM:
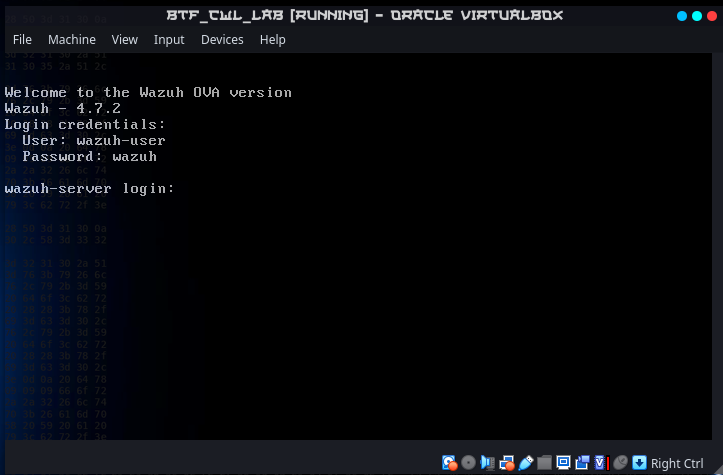
Then, run it. We will see a the server login prompt in terminal:
Step 2 - Access to Server (Lab) Via browser
In the VM machine, make sure that the lab’s network service is refreshed by:
sudo system restart network.serviceAnd see its IP address to access it via browser on host machine:
ip addr | grep eth0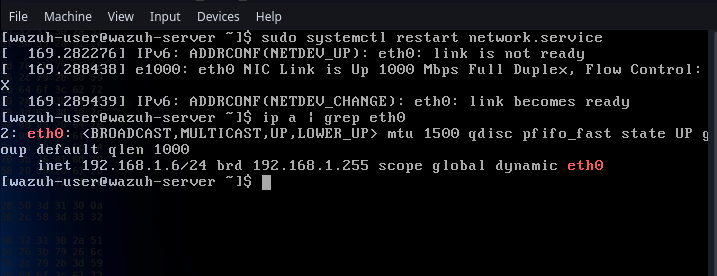
So, my lab IP address is 192.168.1.6. On the host machine, I ping it to see the network is reachable:
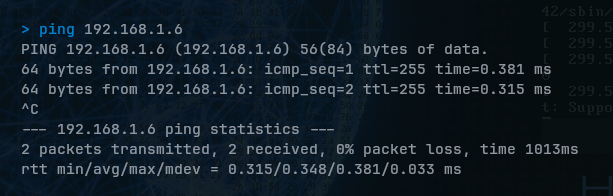
If it doesn’t succeeded, make sure the lab’s VM network settings are set to Bridge Adapter.
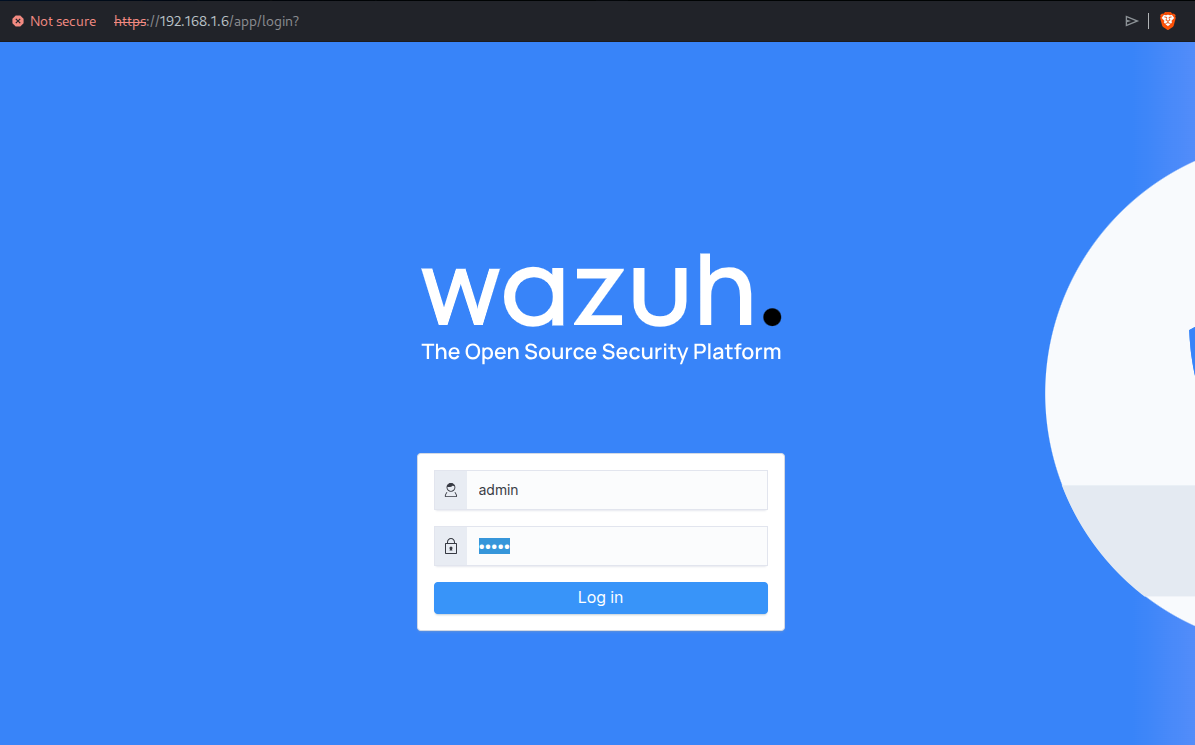
Open a browser and enter https://<server_ip>:
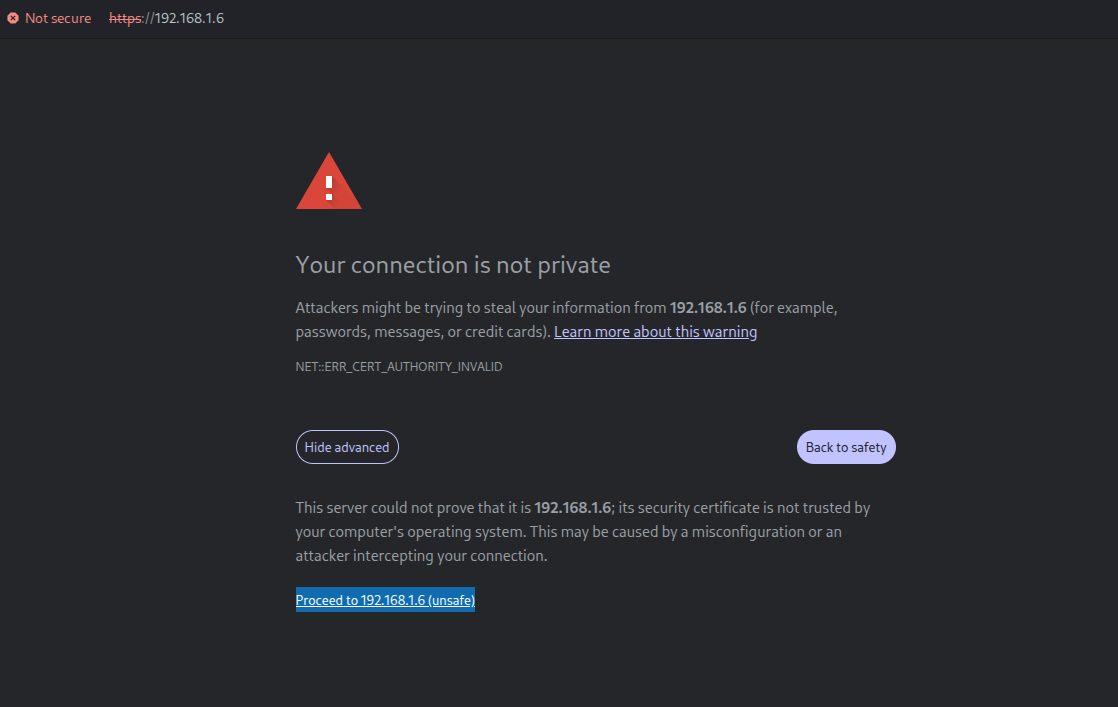
If you see this, the server is reachable and you can proceed. Then, you will see Wazuh login page (username: admin, password: admin):
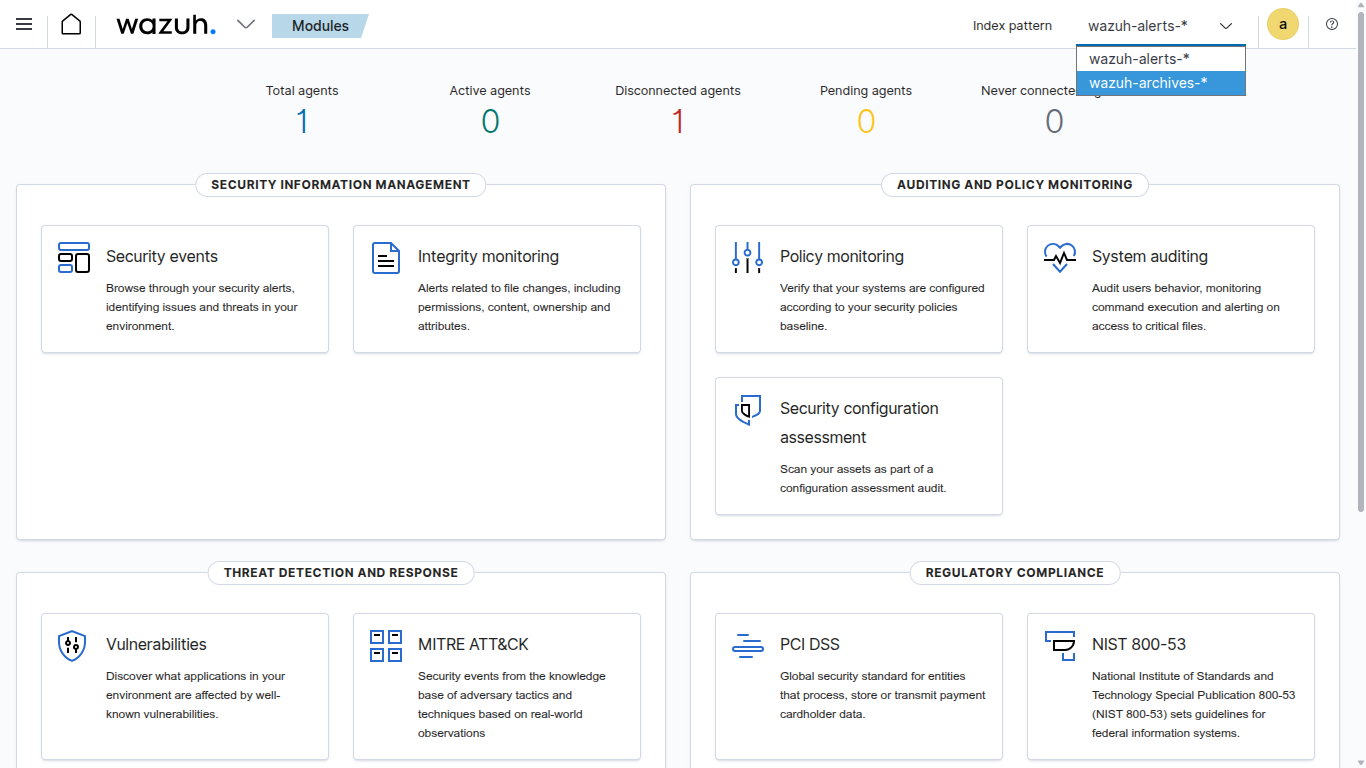
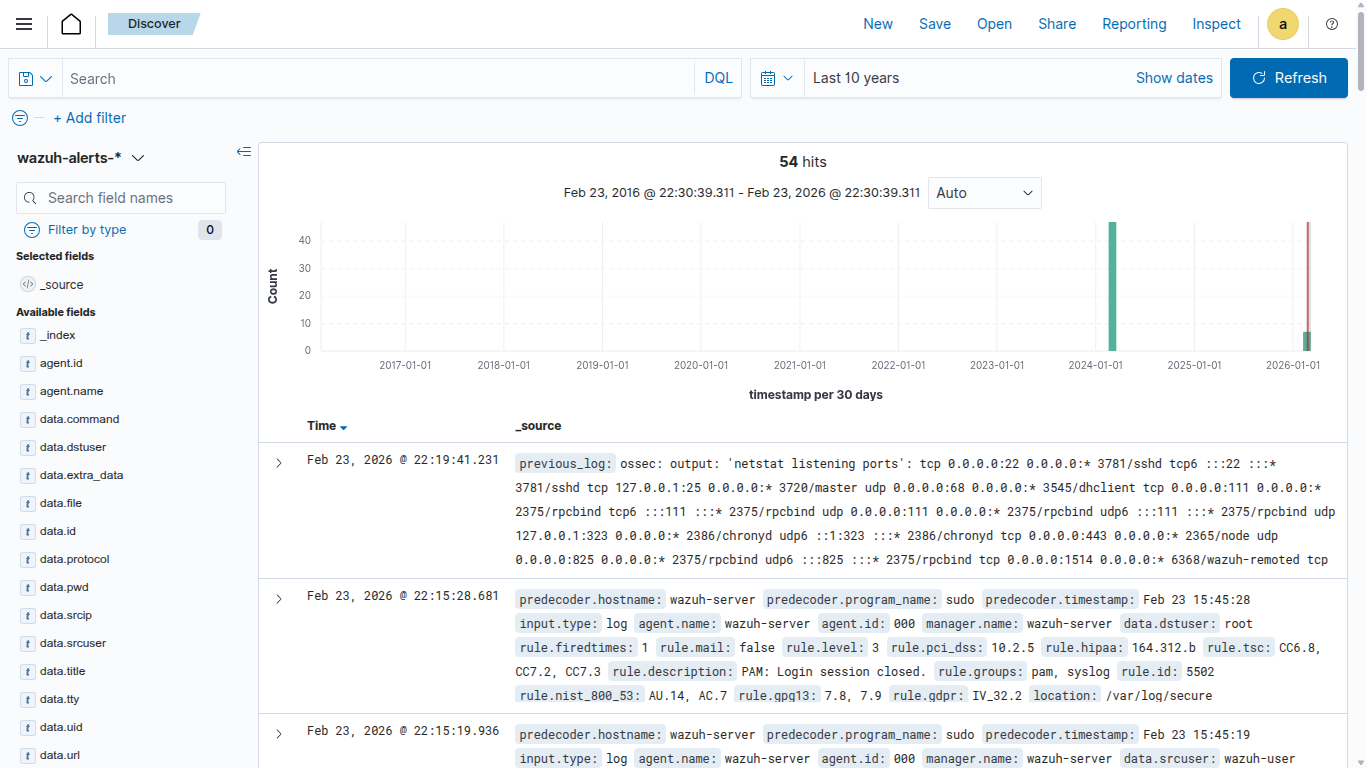
After all, we’ll see a SIEM dashboard after successful login. First of all, change wazuh-alerts-* to wazuh-archive-* because this is where we will be doing investigation scenarios:
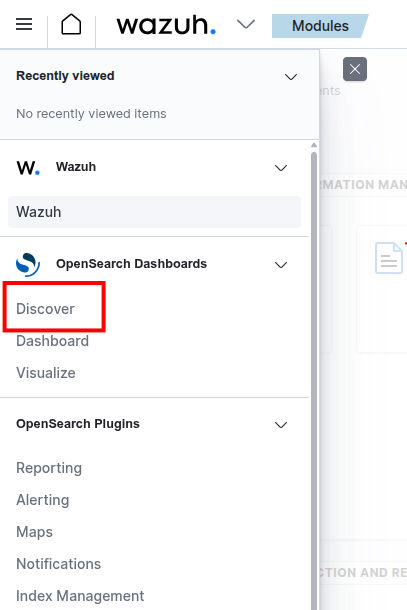
To start investigating, head to Menu > Discover:
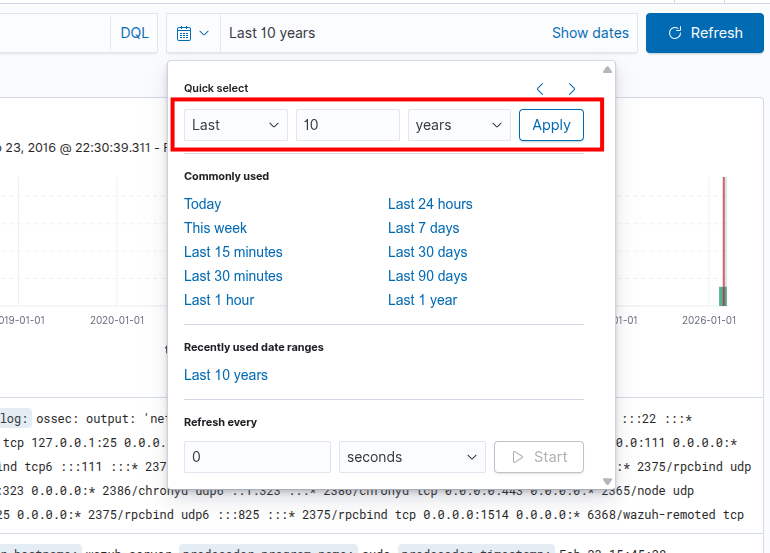
After that, you must change your dashboard’s date ranges to Last 10 years to make sure all the attack logs are visible for this lab (because this lab was created on 2024):
Finally, we can start our hands-on blue teaming operations!
Web Investigation
Exercise: 1.1 | SQL-Injection Activity detected
Objectives
The primary objective is to conduct a thorough investigation into a suspected SQl-injection Incident with the goal of identifying the source, scope, and impact of the attack.
Incident Details
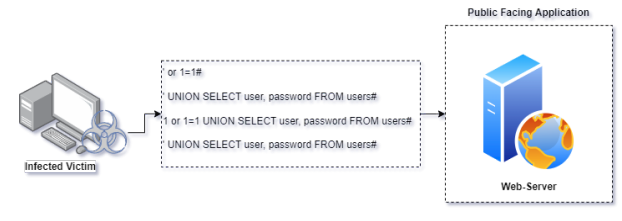
Investigate the suspicious SQL-Injection activity detected by the security monitoring systems. Investigate the web logs to identify the targeted IP, source, and potential impact.
- Targeted URL: http://192.168.117.190/prod/vulnerabilities/sqli
About SQLi
SQL injection is a type of web-based security vulnerability that occurs when an attacker is able to manipulate or inject malicious SQL code into a query. This can happen when input from an application, such as a web form or URL parameter.
The first step of the investigation begins by analysing the web server logs. Open the SIEM Console and navigate to the Discover section:
Note: Make sure that your are under wazuh–archives index
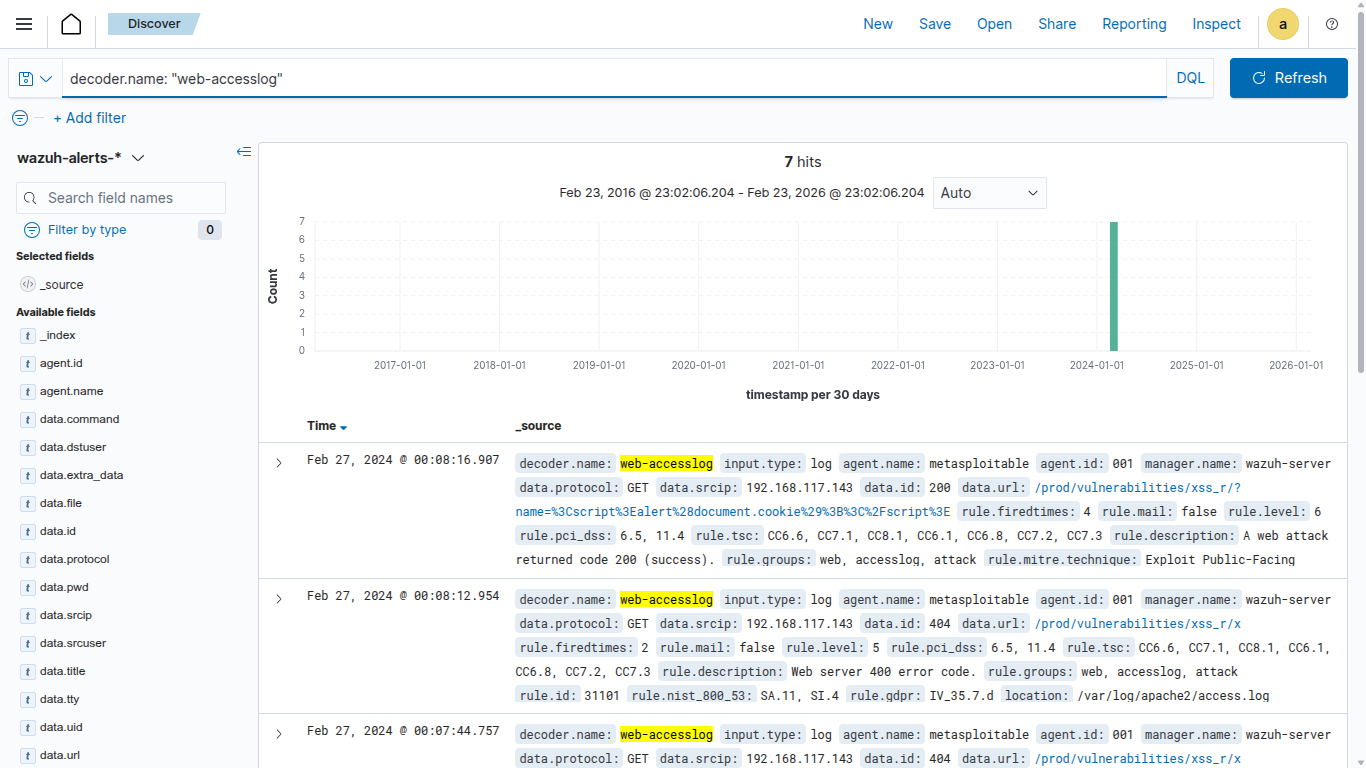
Retrieving the web-accesslog
Identifying and collecting the web access log allows us to extract certain logs for additional
investigation. Use the following command to obtain the web-access log:
decoder.name: "web-accesslog"
Examine the access logs
In general web server logs contain valuable information about incoming requests, errors, and server activities. It is recommended to check the access logs which record every request made to the server.
decoder.name: "web-accesslog" and location : "/var/log/apache2/access.log"
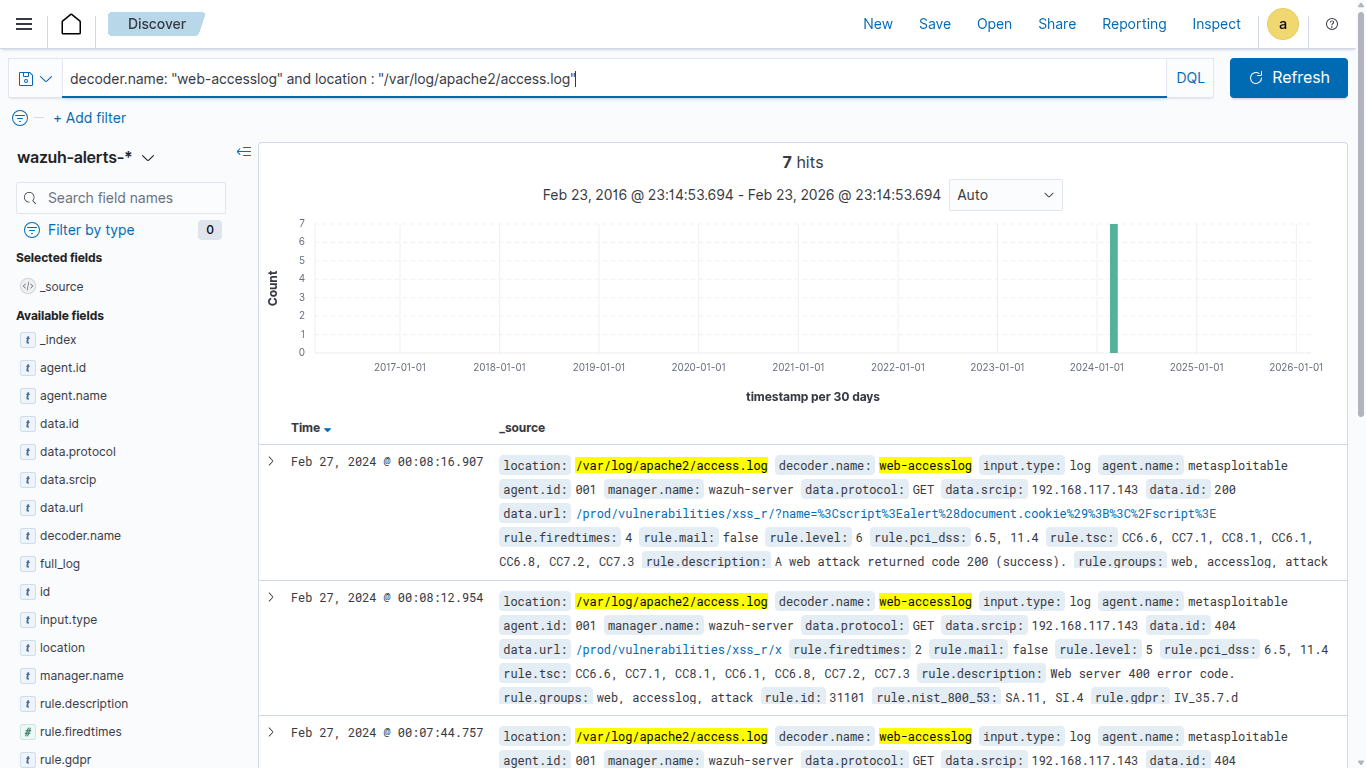
Note: Access logs provide details like IP addresses, requested files, status codes, etc.
Examine the URL
The next step is to observe the URL & URI request observed over the detected URL path, this helps us to identify the requests which are trying to be accessed by the attacker. Execute the below command and observe the findings.
decoder.name: "web-accesslog" and location : "/var/log/apache2/access.log" and data.url: /prod/vulnerabilities/sqli*
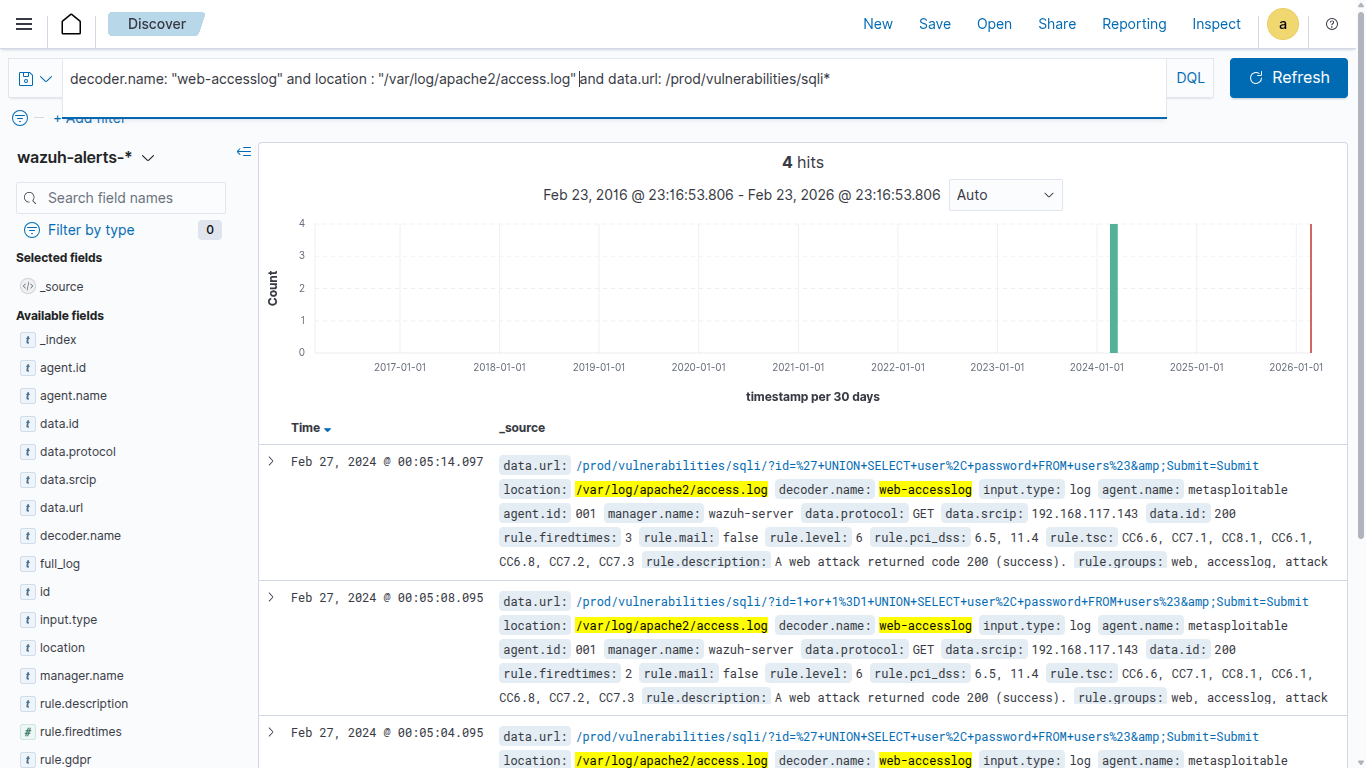
As per the above result, we observed multiple SQL commands over the web url request. In general, it’s not considered as a normal activity when we observe a SQL command over the URL/URI requests
Examine the Status Codes
To validate or identify the suspicious activity it is recommended to check HTTP status codes of the observed logs. Execute the below query and observe the result.
decoder.name: "web-accesslog" and location : "/var/log/apache2/access.log" and data.url: /prod/vulnerabilities/sqli* and data.url: *AND* or *UNION* or *SELECT* and data.id: *
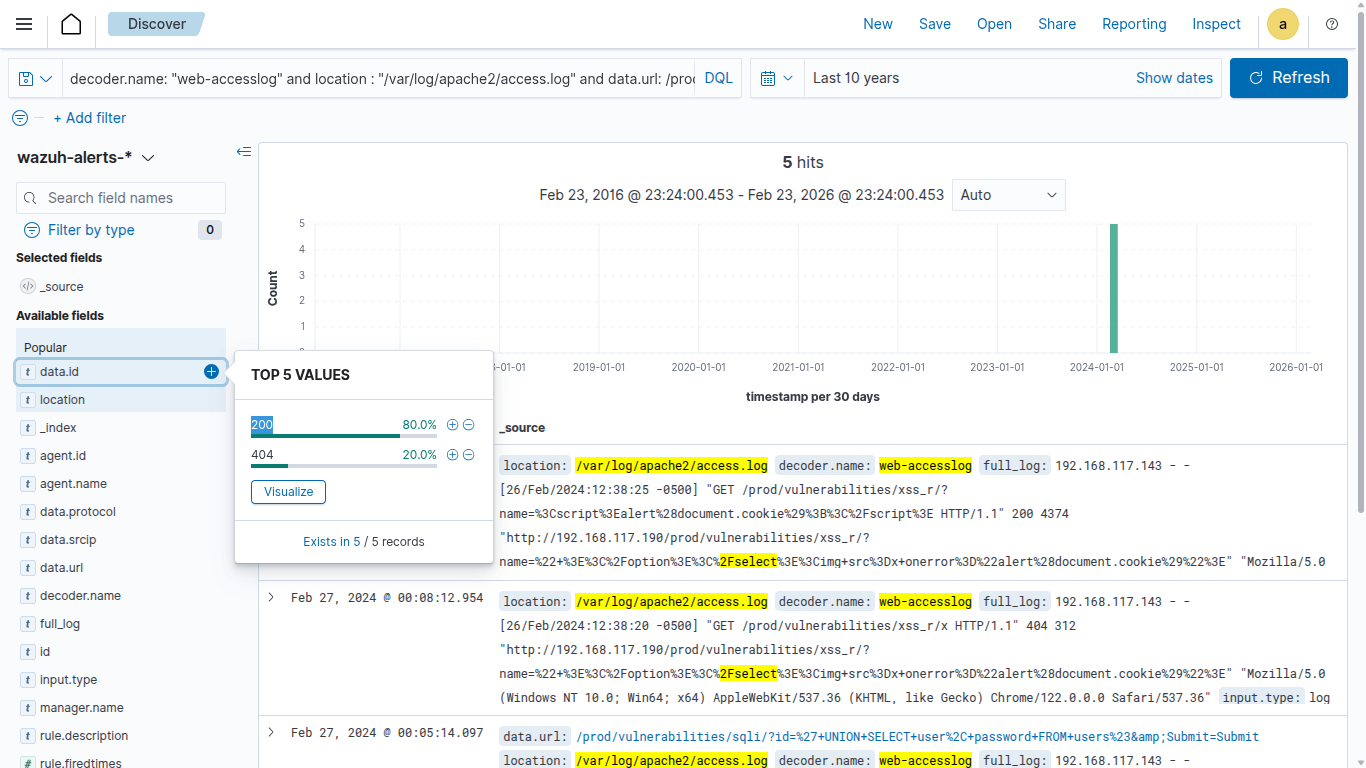
As per the observation we found a request with a status code 200.
Note: HTTP 200 generally indicates a successful HTTP request. This particular request appears when a client sends a GET request to the server, and the server successfully retrieves the requested resource, it responds with a status code of
200.
In case of SQL injection this specific pattern will be observed because the attacker will try executing multiple SQL commands over the web URL.
Identify IP associated with the activity
After Identifying the attack pattern it’s recommended to look for IP addresses associated with the enumeration activity. Execute the below command and observe the finding.
decoder.name: "web-accesslog" and location : "/var/log/apache2/access.log" and data.url: /prod/vulnerabilities/sqli* and data.url: *AND* or *UNION* or *SELECT* and data.id: 200 and data.srcip: *
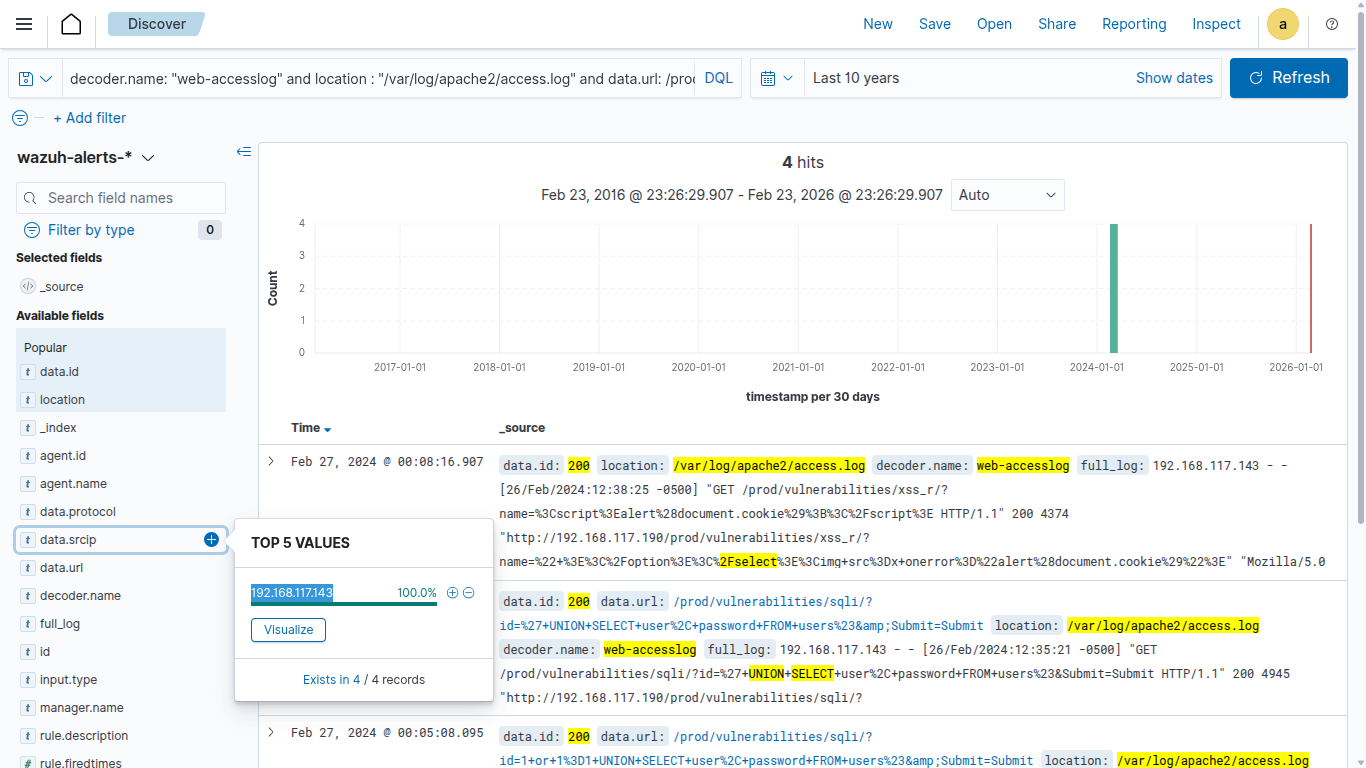
In real case scenarios you might observe a lot more IP activity, it can be categories based on their legitimacy, behaviour and reputation.
Conclusion
The thorough examination of the incident has allowed you to understand the sequence of events leading up to the occurrence, identifying areas for improvement in processes and procedures.
Exercise: 1.2 | Cross Site Scripting Activity detected
Objectives
The primary objective is to conduct a thorough investigation into a suspected Cross Site Scripting Incident with the goal of identifying the source, scope, and impact of the attack.
Incident Details
Investigate the suspicious Cross Site Scripting activity detected by the security monitoring systems. Investigate the web logs to identify the targeted IP, source, and potential impact.
- Targeted URL: http://192.168.117.190/prod/vulnerabilities/xss_r/
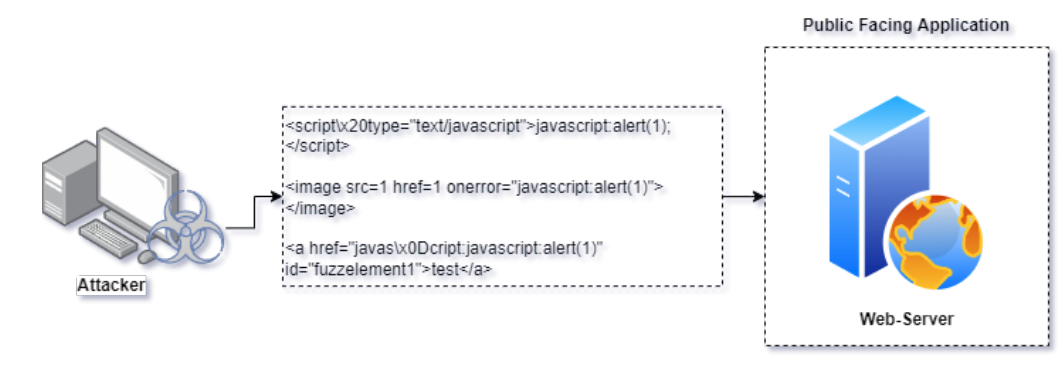
About XSS
XSS is a type of web-based security vulnerability that occurs when an attacker is able to manipulate or inject malicious Java Script commands into a query. This can happen when input from an application, such as a web form or URL parameter.
Examine the URL
This exercise is to observe the URL & URI request observed over the detected URL path, this helps us to identify the requests which are trying to be accessed by the attacker. Execute the below command and observe the findings.
decoder.name: "web-accesslog" and location : "/var/log/apache2/access.log" and data.url : /prod/vulnerabilities/xss_r/*
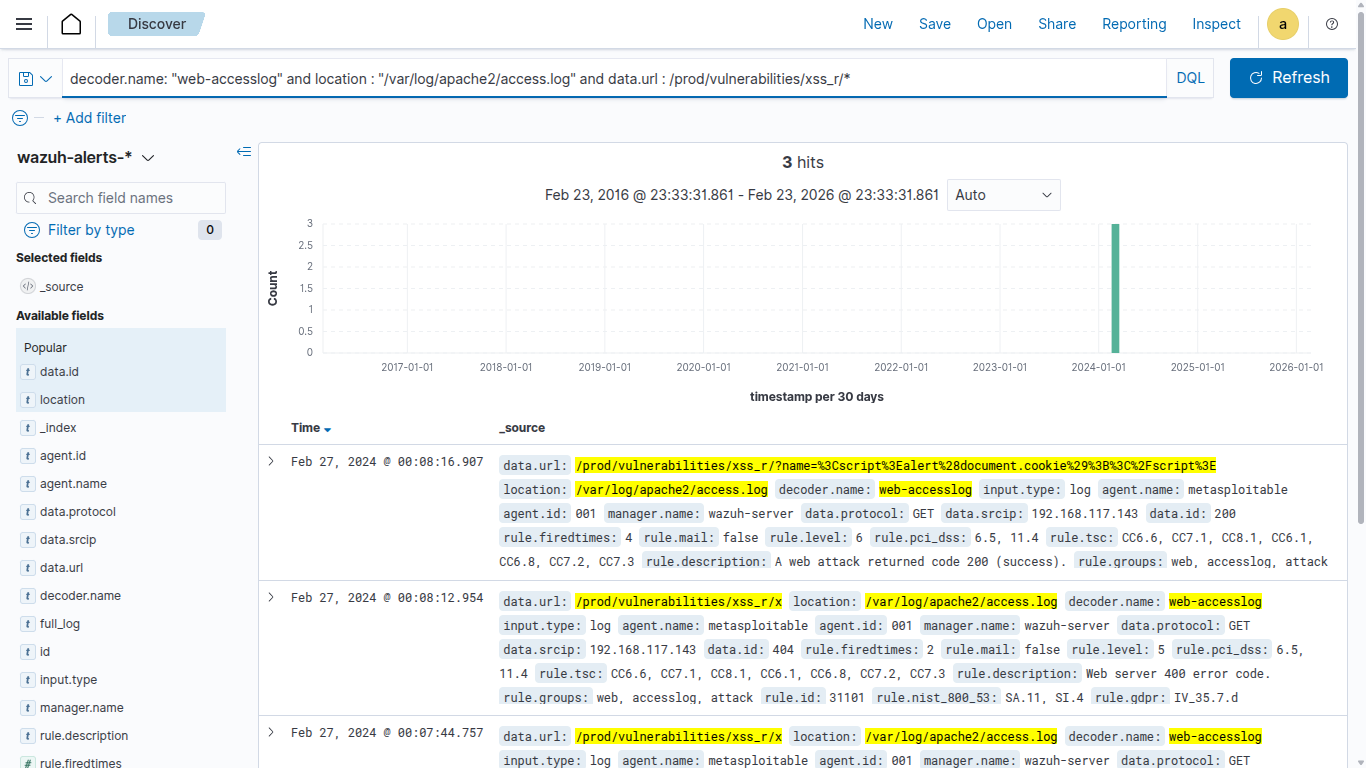
As per the above result, we observed multiple XSS commands over the web url request. In general, it’s not considered as a normal activity when we observe a Java Script command over the URL/URI requests.
Examine the Status Codes
To validate or identify the suspicious activity it is recommended to check HTTP status codes of the observed logs. Execute the below query and observe the result.
decoder.name: "web-accesslog" and location : "/var/log/apache2/access.log"
and data.url : /prod/vulnerabilities/xss_r/* and data.id: *
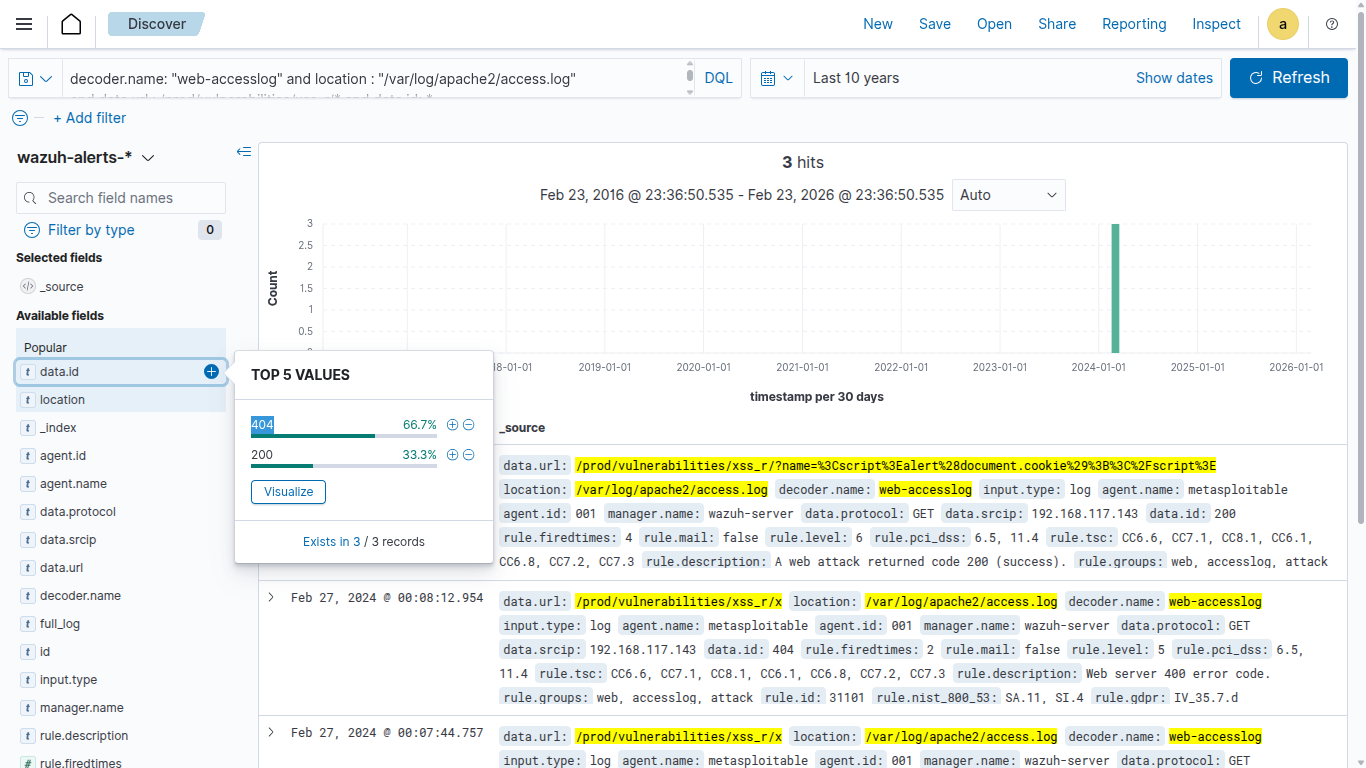
As per the observation we found multiple requests with a status code 200, 404, 302. In case of XSS exploit this specific pattern will be observed because the attacker will try executing multiple Java Script commands over the web URL.
Identify IP associated with the activity
After Identifying the attack pattern it’s recommended to look for IP addresses associated with the enumeration activity. Execute the below command and observe the finding.
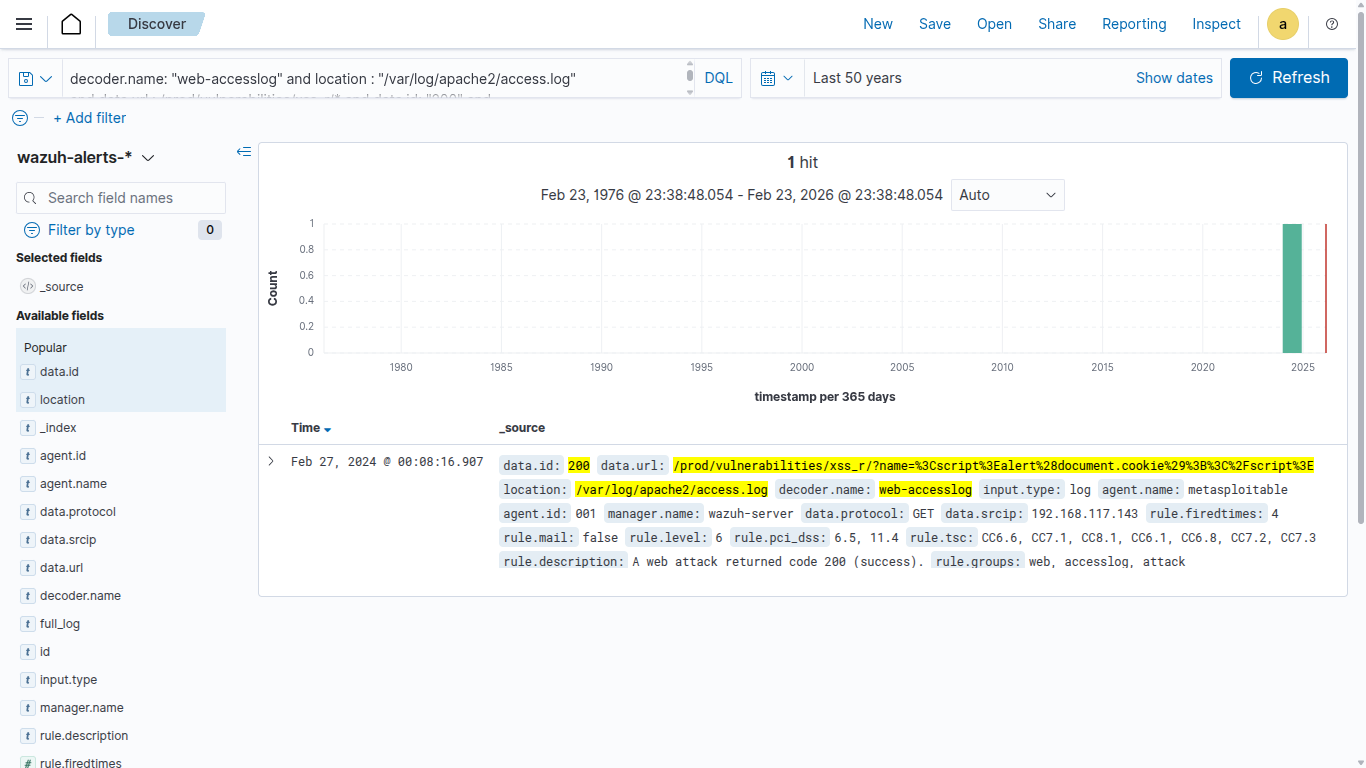
decoder.name: "web-accesslog" and location : "/var/log/apache2/access.log"
and data.url : /prod/vulnerabilities/xss_r/* and data.id: "200" and
data.srcip : *
Exercise: 1.3 | Remote File Inclusion Activity detected
Objectives
The primary objective is to conduct a thorough investigation into a suspected Remote File Inclusion Incident with the goal of identifying the source, scope, and impact of the attack.
Incident Details
Investigate the suspicious RFI activity detected by the security monitoring systems. Investigate the web logs to identify the targeted IP, source, and potential impact.
- Targeted URL: http://192.168.117.190/prod/vulnerabilities/upload/
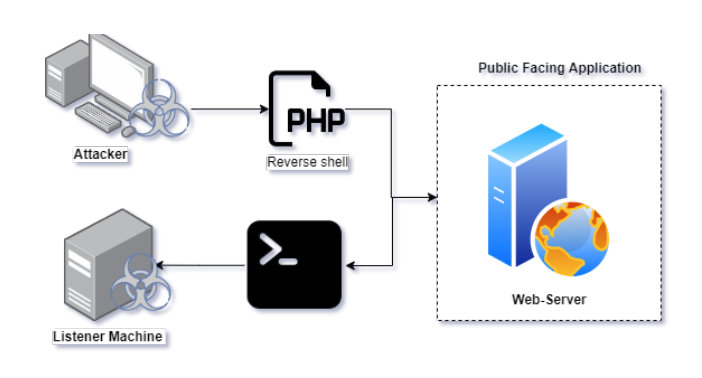
About RFI
RFI is a type of web-based security vulnerability exploit that occurs when an attacker is able to upload suspected files including php, ps1, exe, ddl etc directly into the web server. This can happen when the upload function of a web application has not been properly sanitised, by exploiting such a vulnerability the attacker can directly deploy the payload and gain a stable shell with the targeted web server.
Examine the URL
The next step is to observe the activity which is associated with the detected URL, Execute the below command and observe the findings.
decoder.name: "web-accesslog" and location : "/var/log/apache2/access.log" and data.url : /prod/vulnerabilities/upload/
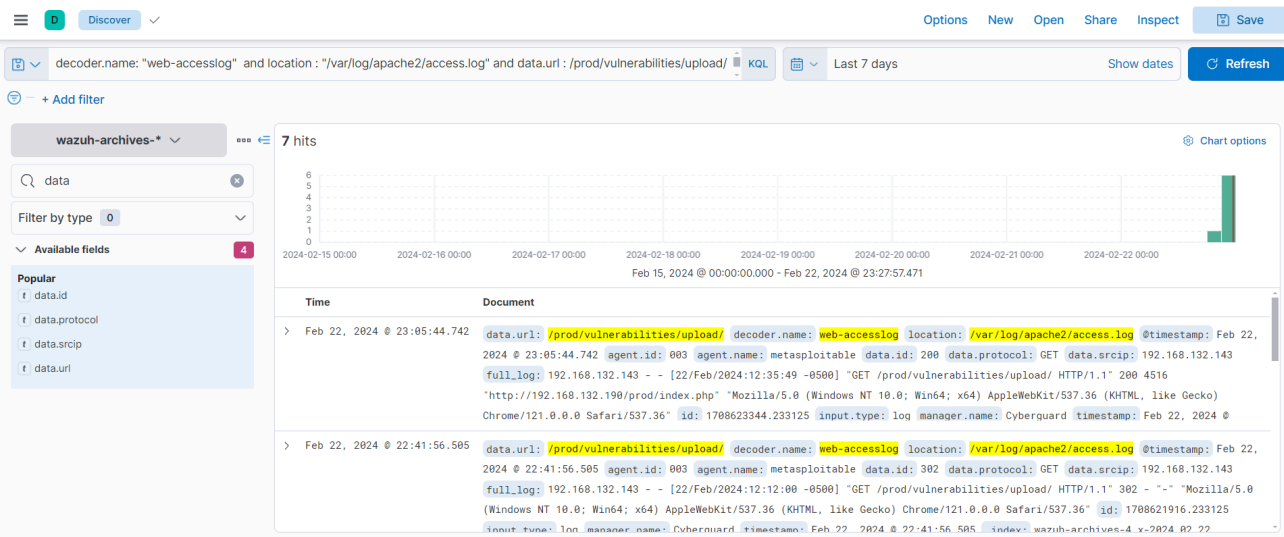
Investigate the POST request
Generally, an HTTP POST request is used during the file upload process on a web application.
decoder.name: "web-accesslog" and location : "/var/log/apache2/access.log"
and data.url : /prod/vulnerabilities/upload/* and data.protocol : "POST"
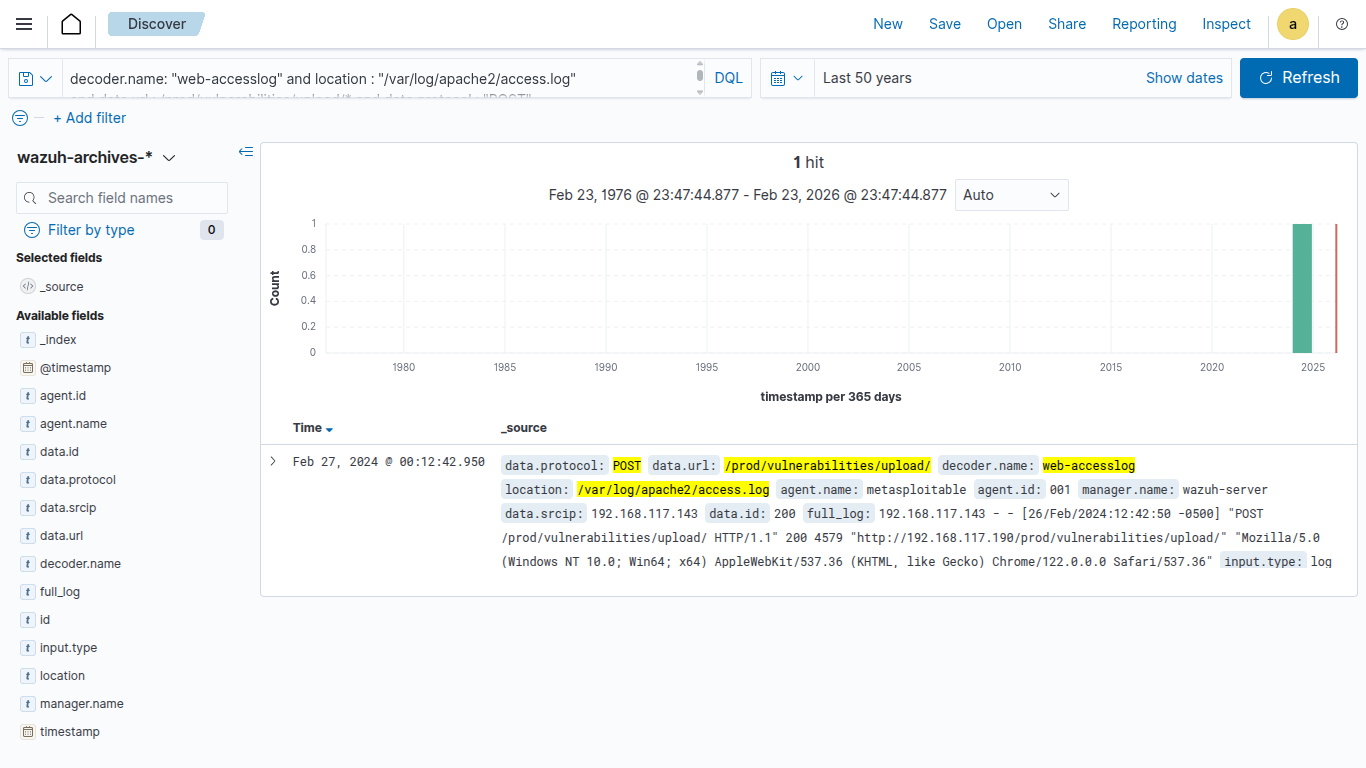
Co-relate with PCAP
In-general POST request doesn’t provide a high visibility, in such it is recommend to correlate with network traffic, in our scenarios we have attached the PCAP file of the specific activity named: suspected.pcapng
Wireshark is a popular and powerful open-source network protocol analyzer. It allows you to capture and inspect the data travelling back and forth on a network in real-time or from a previously recorded file. Wireshark supports a wide range of protocols and provides detailed information about the packets exchanged between devices on a network.
Execute the below mentioned command over the wireshark to specifically filterout detected src IP activity:
ip.addr == 192.168.132.143
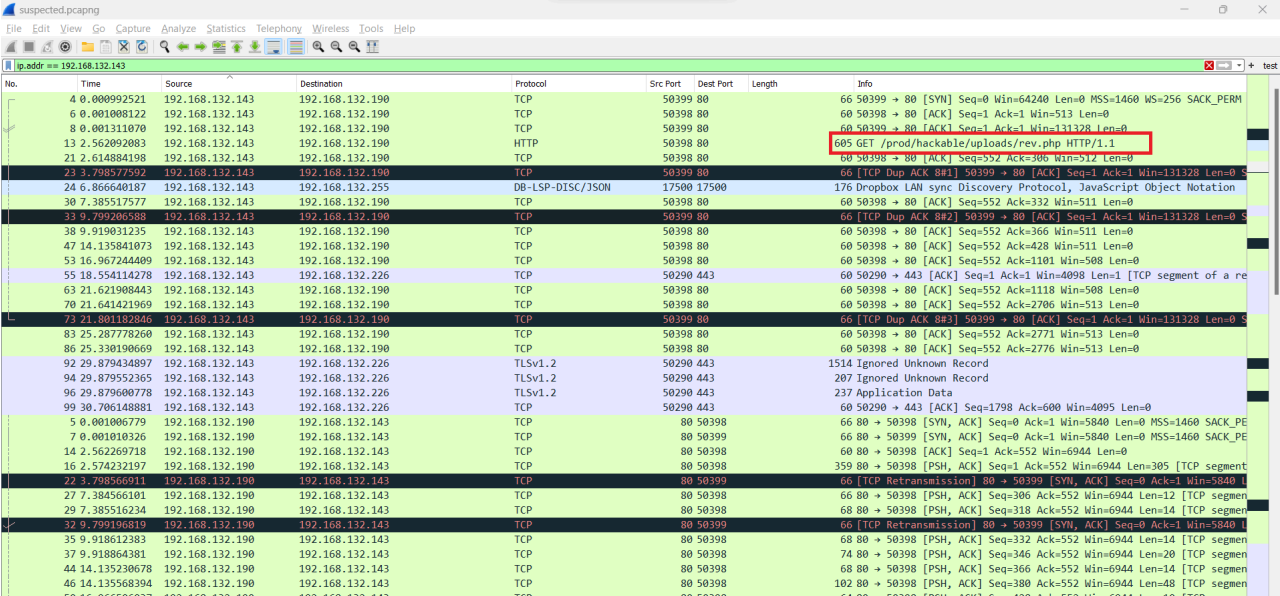
For the above result we identified that the src has been try access the url /prod/hackable/uploads/rev.php
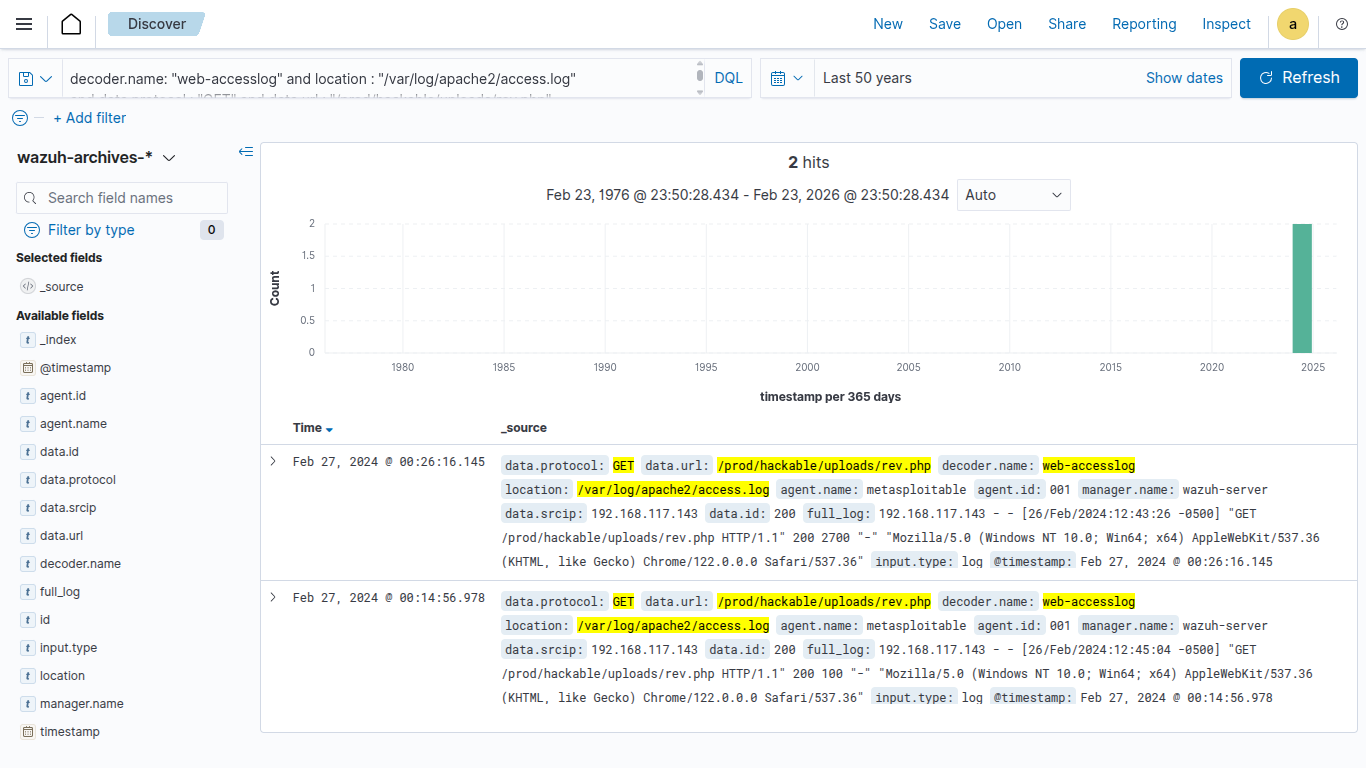
Investigate the detected file activity
The next step is to attempt to get the detected information via the SIEM console after identifying the file, which is advised to be redirected to. Execute the below mentioned command and observe the result.
decoder.name: "web-accesslog" and location : "/var/log/apache2/access.log"
and data.protocol : "GET" and data.url : "/prod/hackable/uploads/rev.php"
Identify the root cause
After gathering every possible information it’s time to determine the root cause for the detected activity, typical RFI will maintain a stable shell with the attacker machine. To determine the particular activity again redirect to the PCAP file and execute the following command:
ip.src == 192.168.117.190
We have simply keep the detected src as a destination to observe every incoming request.
In-real case scenarios the network traffic might be too hard to be prioritised due to its large network connectivity, in such cases it’s recommended to check based on the suspected port based access. As per the observation over the PCAP we observed that the src is been trying to communicating to an suspected IP over the port 9001:
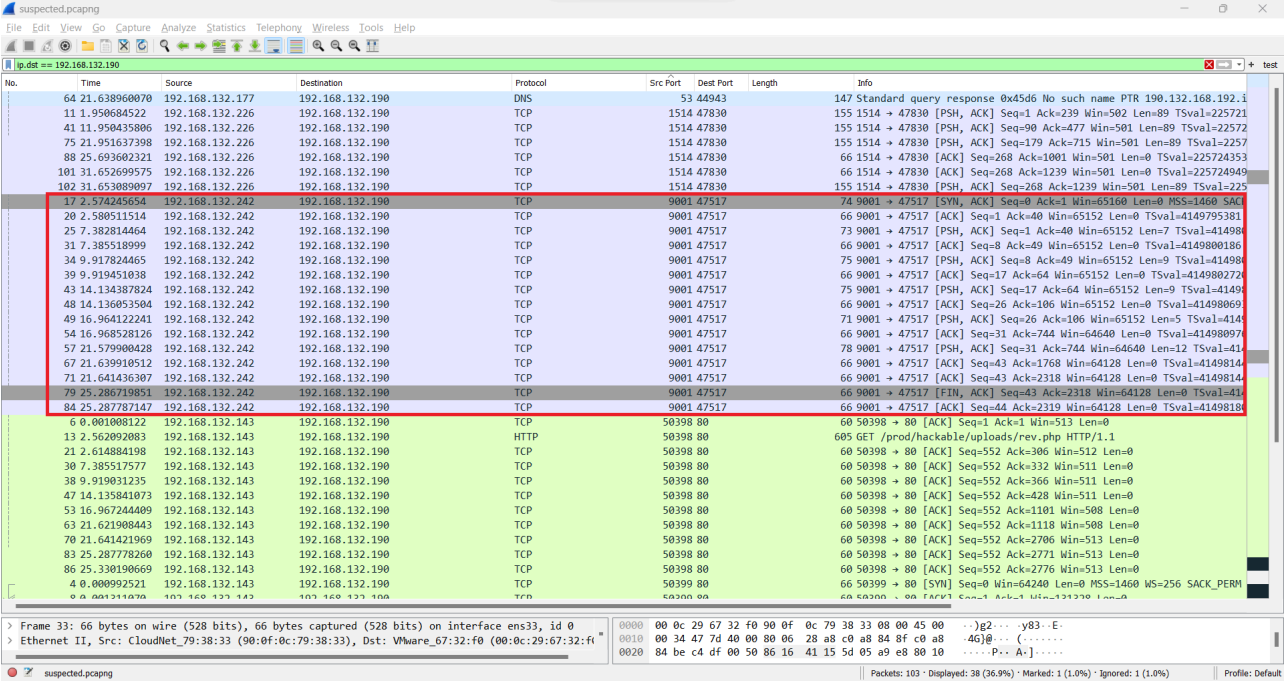
Execute the below mentioned command to specifically filter out the suspected port activity:
ip.dst == 192.168.117.190 && tcp.srcport == 9001
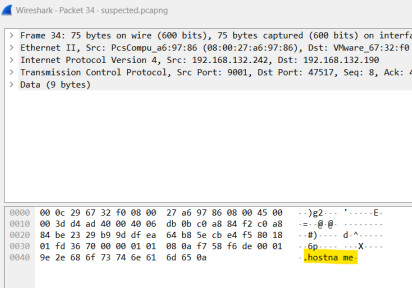
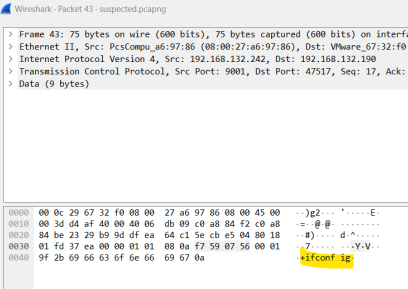
On further deep investigating the packet we identified multiple host command over the targeted web-server.
 |  |
|---|
Network Investigation
Exercise: 1.4 | External Network Communication Detected
Objectives
The primary objective is to conduct a thorough investigation into a suspected external network communication Incident with the goal of identifying the source, scope, and impact of the attack.
Incident Details
Investigate the suspicious external communication activity detected by the network monitoring systems. Investigate the PCAP to identify the targeted IP, source, and potential impact.
Resources:
- PCAP File Name:
externalpcapng - Target Port:
4444
About RFI
External network communication refers to the interaction and data exchange between a local network and external networks, when a attacker successfully deploy the payload over the host machine it will establish a stable connection between the attacker and the victim.

The first step of the investigation begins by analysing the given network PCAP. We have provided you with the suspected PCAP file which has been extracted from one of the compromised host machines.
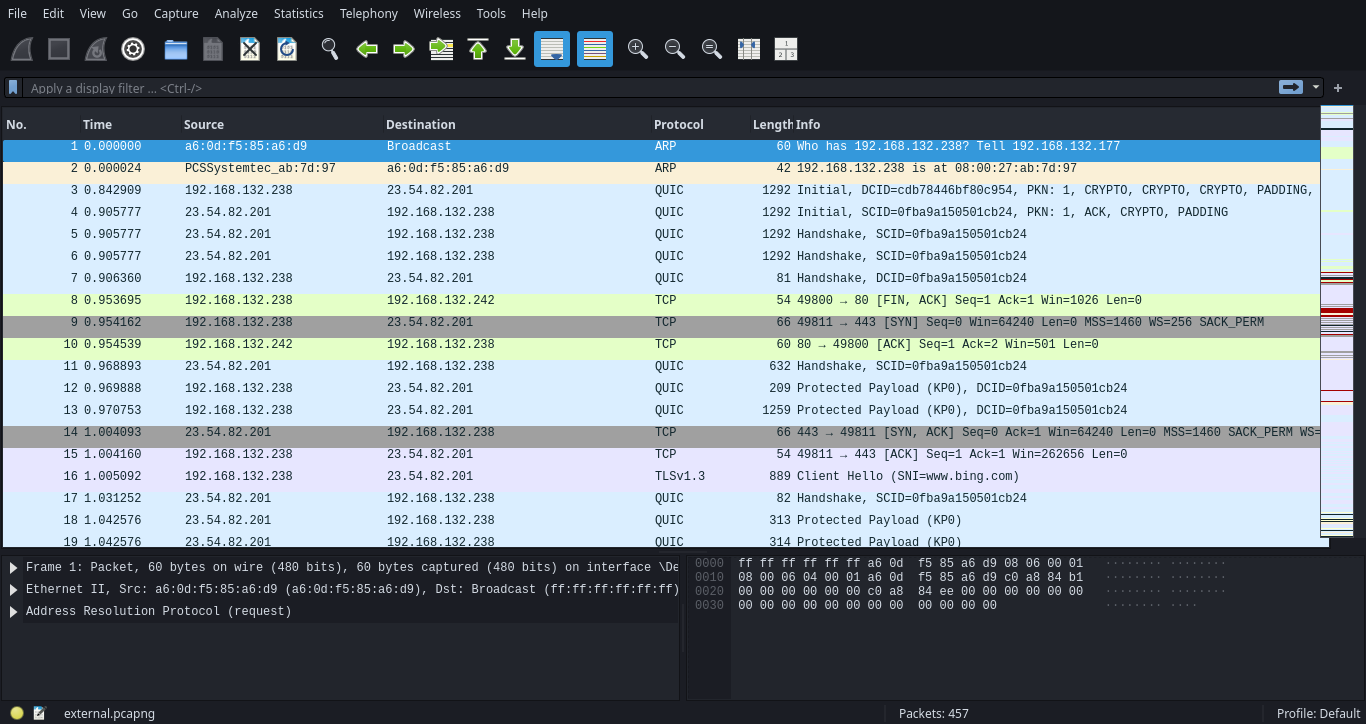
Wireshark is a popular open-source network protocol analyzer that allows users to capture and inspect the data travelling back and forth on a network in real time.
Investigating external communication involves careful steps to ensure security and determine the nature and potential threats associated with the network logs.
- Prioritise the detected port activity
- Identifies source and destination IP addresses
- Examine the traffic flow
- Examine the External to Internal traffic
Prioritise the detected port activity
Identifying and extracting particular logs which are associated with the identified activity. Use the following command to obtain the web-access log.
tcp.dstport == 4444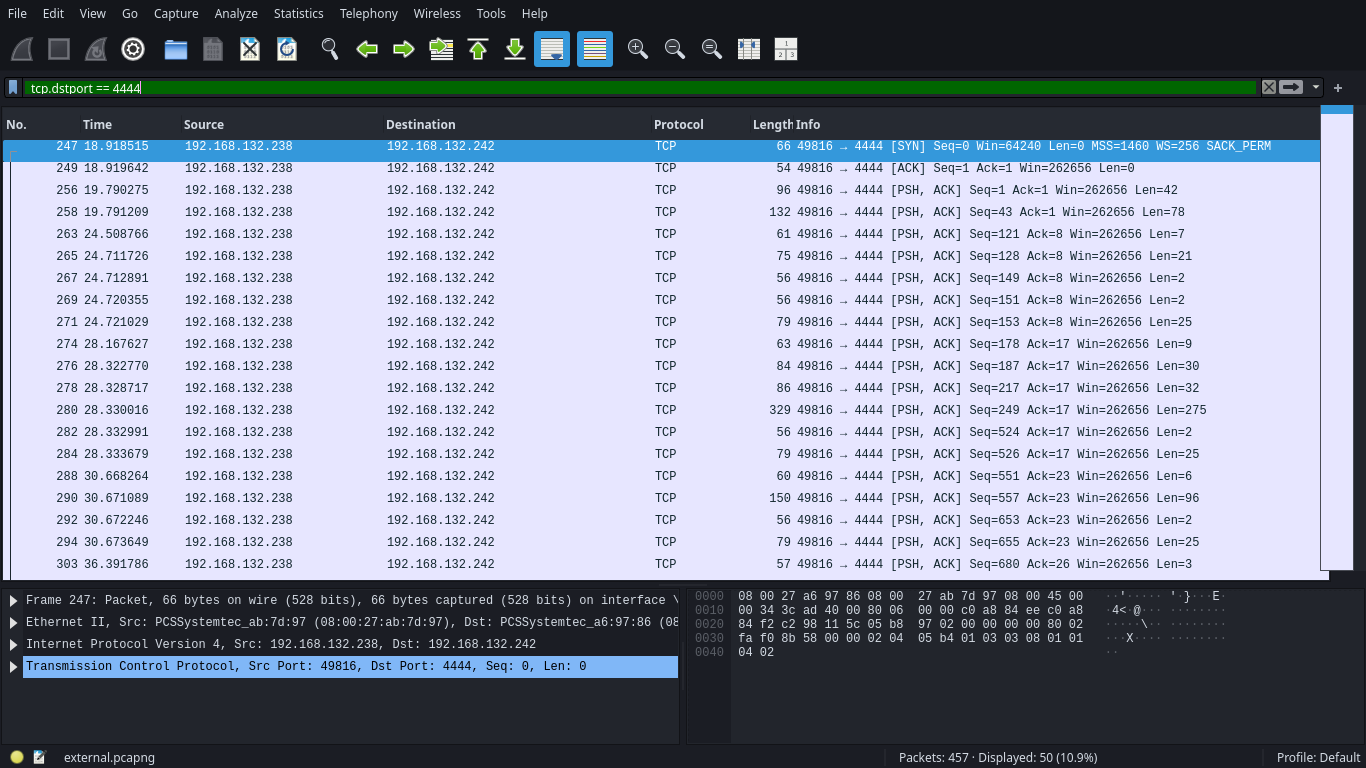
Decoders are the key components which are responsible for parsing raw logs into a structured format that can be easily analysed and understood by the system.
Identifies source and destination IP addresses
The next step is to identify and retrieve the IP activity which are associated with the detected port activity, from the above result we identified that the src 192.168.132.238 → 192.168.132.242 over destination port 4444.
tcp.dstport == 4444 && ip.src == 192.168.132.238 && ip.dst == 192.168.132.242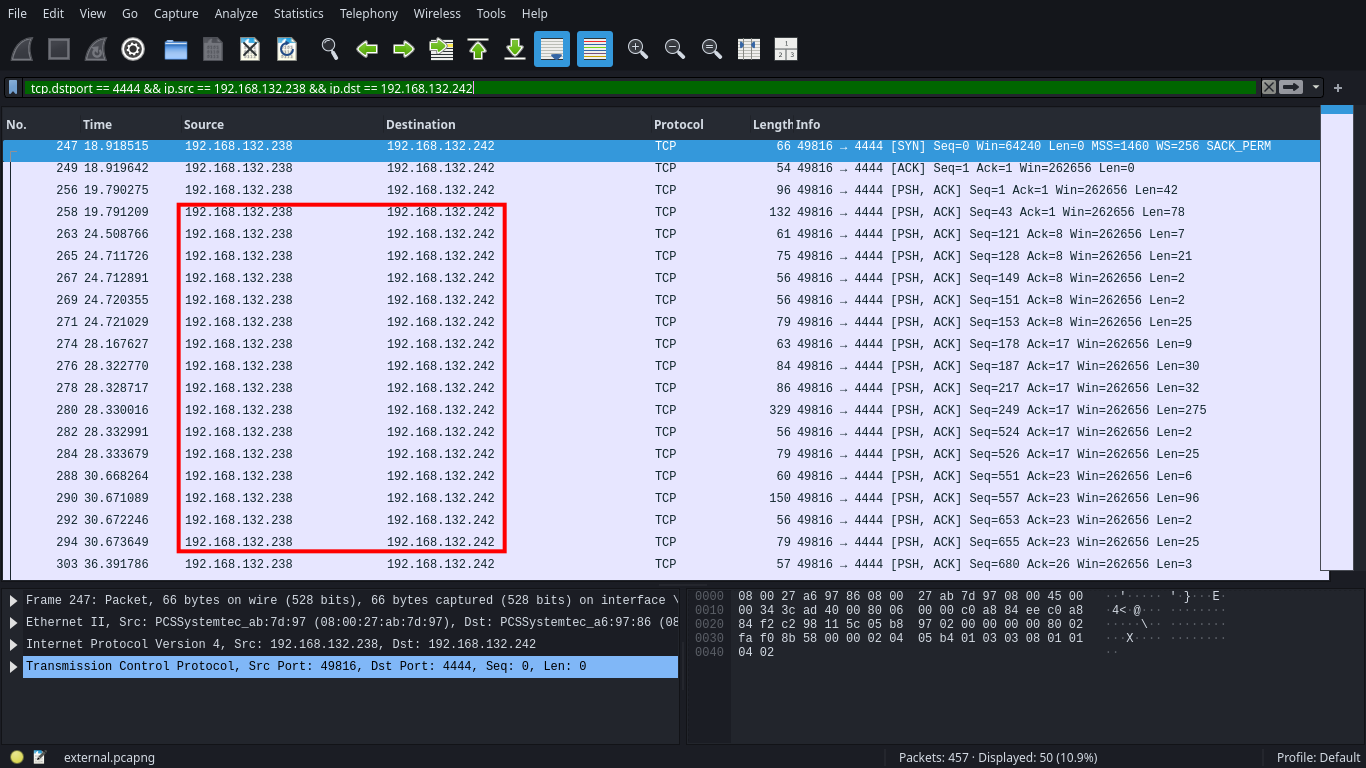
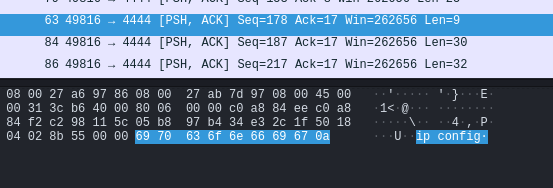
Examine the traffic flow
To examine the network traffic it is recommended to check the packet flag from the above observation result. We identified SYN ACK this pattern observed when a src dest established a stable communication, and PSH command generally observed when a src trying to transmit data or executing command.
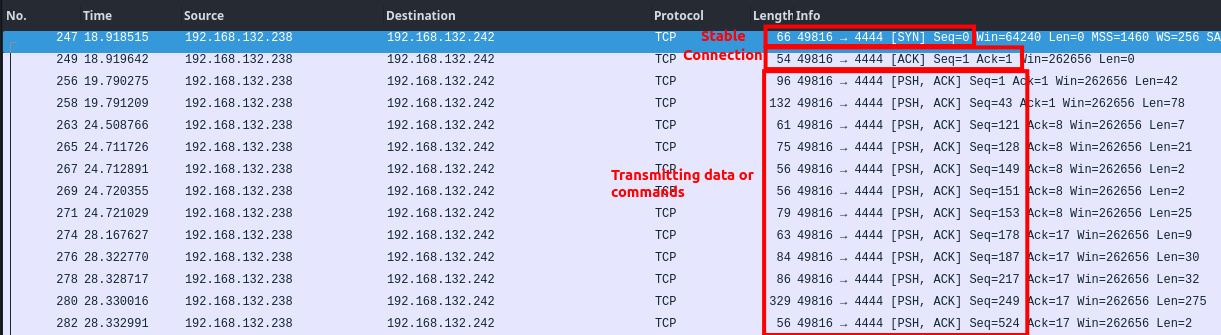
This particular pattern was observed when a victim got compromised and established a stable shell with the attacker machine. On further checking the packet we identified multiple OS command associated with the network activity.
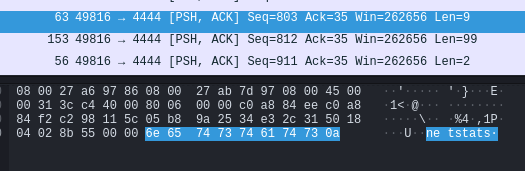
Examine the External to Internal traffic
After determining the suspicious attack pattern its recommend to check the reverse traffic vice verse, by examin the vice verse traffic its give a better visibility over the detected activities.
ip.src == 192.168.132.242 && ip.dst == 192.168.132.238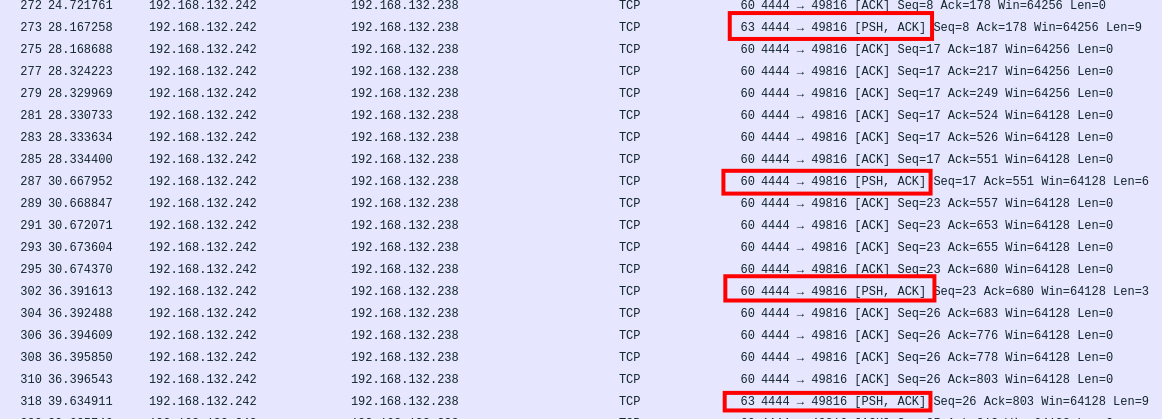
As per the above result we identified a stable communication with multiple PUSH requests, examining the PUSH request to identify the command execution.
Conclusion
- Port
4444is been associated with suspicious network communication on Remote File Inclusion Activity detected. - Src port
49816is associated with dst port4444in givenexternal.pcapng.
Forensics Investigation
Exercise: 1.5 | Memory Dump Analysis
Objectives
The primary objective is to conduct a thorough investigation into a suspected memory dump with the goal of identifying the source, scope, and impact of the attack.
Incident Details
Investigate the suspicious endpoint compromise activity by the Endpoint monitoring systems. Investigate the .RAW file to identify the targeted IP, source, and the root cause of the activity.
- Memory Dump:
suspected.raw
About Memory Dump Analysis
Memory dump analysis plays a critical aspect of identifying the root cause and incident response, A memory dump, also known as a core dump or a crash dump, is a file that captures the contents of a computer’s volatile memory at a specific point in time. This snapshot of memory can provide valuable information for understanding system behaviour, identifying anomalies, and investigating security incidents.
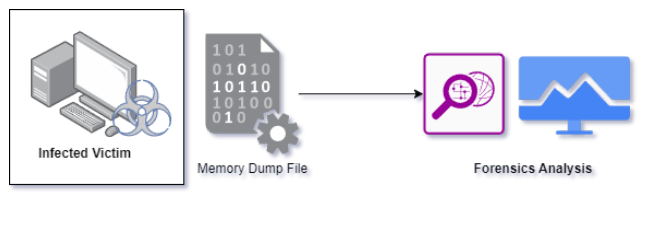 The first step of the investigation begins by analysing the given memory dump. We have provided you with the suspected RAW file which has been extracted from one of the compromised host machines.
For our investigation we will be processed using the volatility3-2.4.1, feel free to download from the following:
git clone https://github.com/volatilityfoundation/volatility3/archive/refs/tags/v2.4.1.zipGather the information
The first step of investigation begins by analysing the basic information such as the operating system version, architecture, and system configuration can aid in accurately identifying the system being analysed.
Use the following command to obtain the basic information for the detected image dump.
sudo python3 vol.py -f <file_path> windows.info.Info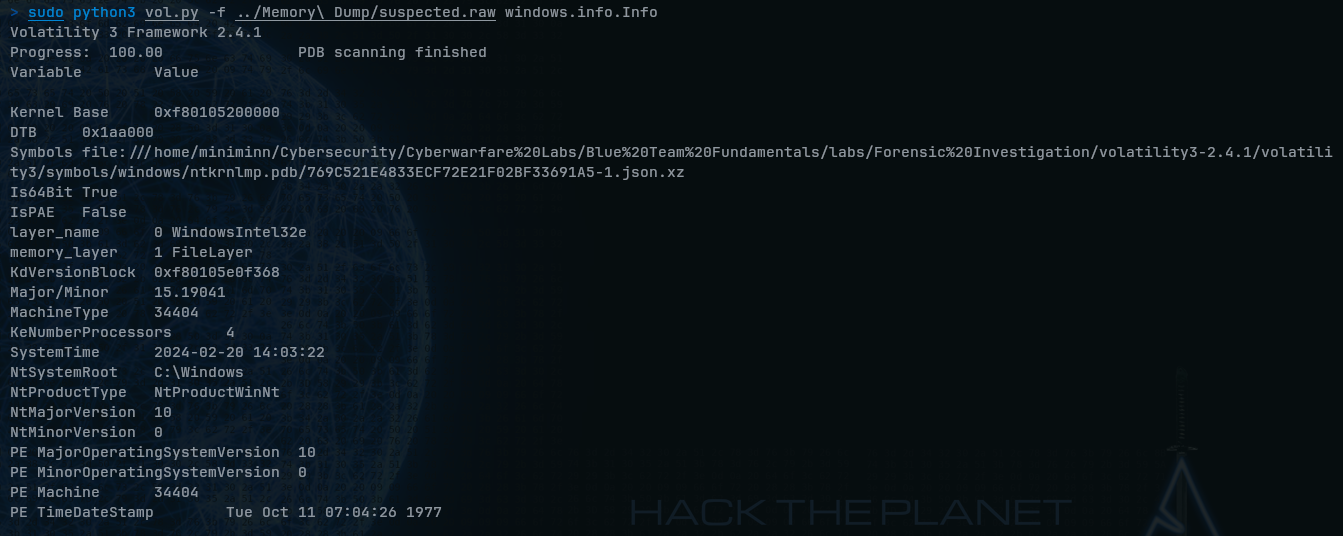
Examine the running process
After gathering the basic information the next step is to investigate and begin by analysing the behaviour of running processes, this particular approach will help in understanding normal and abnormal activities on the detected compromised system.
sudo python3 vol.py -f <file_path> windows.pslist.PsList
Searching for the suspected process in a memory dump is like trying to find a needle in a haystack. It generally requires a high level of skill-set of understanding, it’s recommended to go through each and every running process and filter-out the suspicious process.
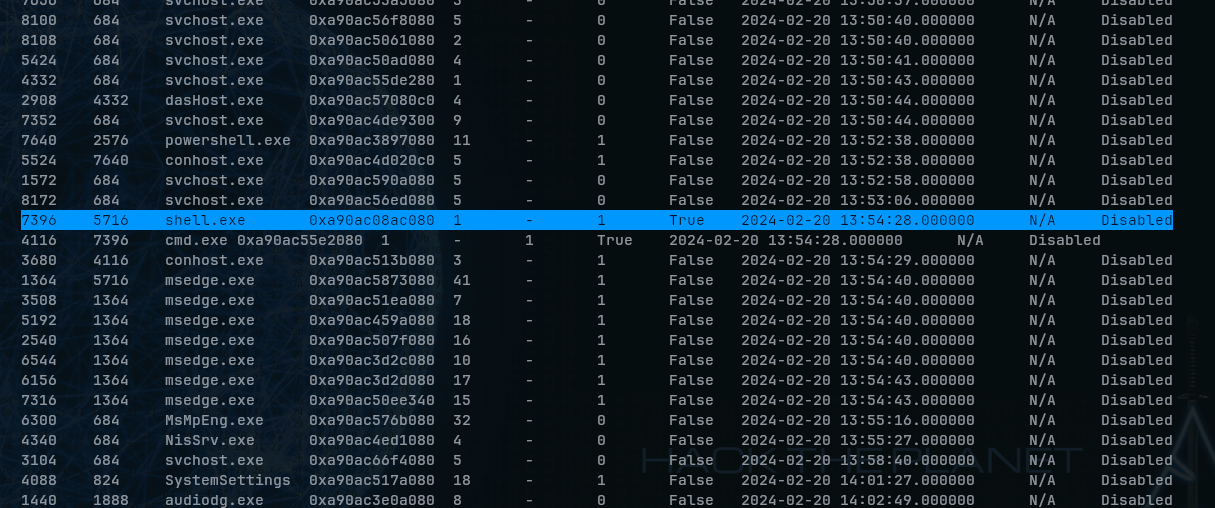
As per the above result the file shell.exe seems to be a suspicious process running.
Determine the command line activity
After determine the suspicious process its recommend to cross verify the process with the
command line activity execute the below mentioned commands and observe the findings
sudo python3 vol.py -f <File_Path>/suspected.raw windows.cmdline.CmdLine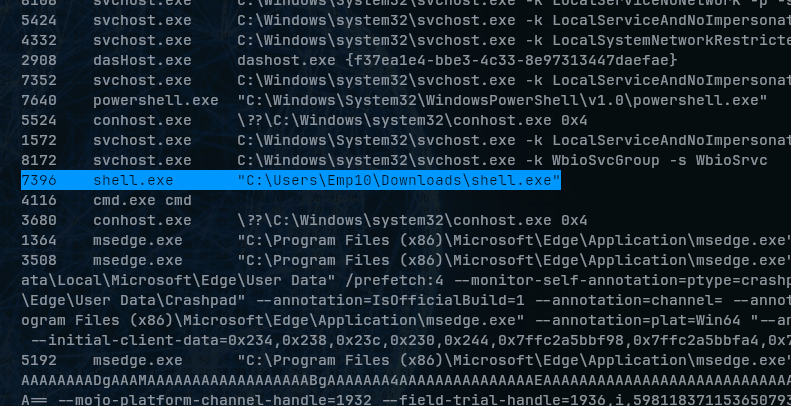
As per the above result we did not observe any suspicious command execution associated with the executables.
Generally many malicious exe are been associated with multiple command execution activity, it’s been recommended to cross-verify the activity which are associated with the detected
.exe
Download the detected DUMP file
Next step of the investigation is to download the detected suspicious file for further investigation to, using our raw image file we can easily retrieve the file using the PID value associate with it, execute the below mentioned commands and observed the result:
sudo python3 vol.py -f <file_path>/suspected.raw windows.pslist --pid 7396 --dump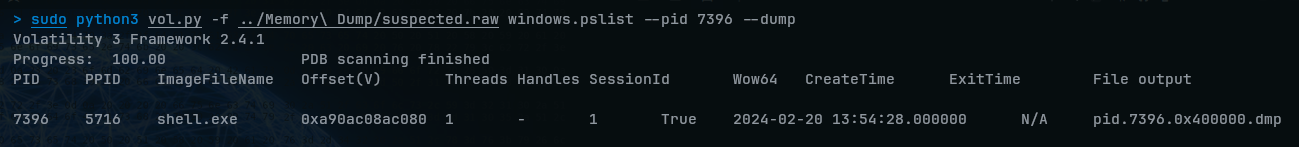
After extracting the dump the next step is to check for the strings associated with the dump file.
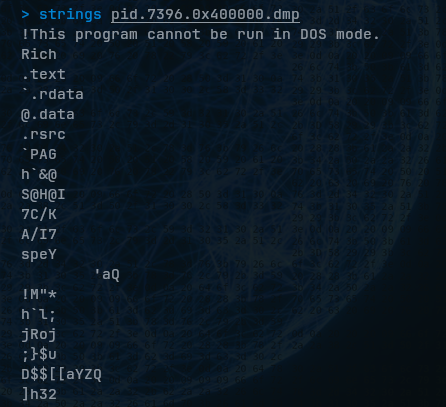
In majority of the cases we might find interesting value but we did not observed any interesting value in our case it recommended to analyse the dump via VirusTotal, upload the extracted dump directly into the VirusTotal for further analysis: https://www.virustotal.com/gui/
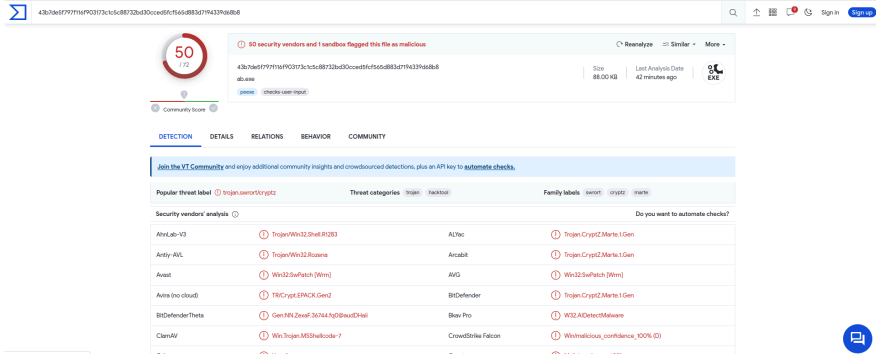
As per the result from the VT, we confirm that the detected file is malicious.
Examine the network traffic
After determining it suspiciousness its recommend to determine whether is there any network activity associated with the detected file, to list all network connection execute the below mentioned command and observed the result:
sudo python3 vol.py -f <file_path>/suspected.raw windows.netstat.NetStatWhen we got the result, we clearly observed that the detected executable shell.exe has been successfully communicating to an IP 192.168.121.242 via port 4444